A team I was supporting needed a Data API to integrate in a downstream user facing system.
The data they needed to serve lived in Databricks, and I had to find a way to make it available to the API in a secure and scalable manner.
The response time for the API didn’t need to be too fast, with up to 5 seconds being acceptable performance, so I decided to test serving the data directly from the Databricks SQL warehouse.
This post shares my findings from load testing Databricks SQL Warehouse with concurrent queries, analysing whether it can scale for this use case.
Methodology
This is the methodology used to run the experiment:
Create a baseline.
Run a load test for each of the proposed configurations.
Compare load tests to baseline.
Preparation
For this use case I decided to go for the serverless compute because it was the only option that can scale fast enough if there is a spike of requests.
Databricks recommends that for running multiple queries at one time, you should increase the number of clusters
If you are running multiple queries at a time [serverless], add more clusters for autoscaling. link
Autoscaling only kicks in after queries have been added to the queue. I wanted to find the right balance between min clusters available vs autoscaling clusters.
If the queue is not decreasing quickly enough, autoscaling kicks in to rapidly procure more compute. link
The Queries
These are the queries used for this test. Query B is a simpler query with a GROUP BY clause. Query A is a bit more resource intensive with JOINs and window operations.
The load tests are executed using a Locust script that hits the databricks SQL Warehouse API for the two queries. Each query type is executed an equal number of times.
To ensure realistic results, caching is also disabled. On top of that, the SQL query parameters are randomised to prevent from submitting repeated queries as much as possible.
Baseline
The baseline consists on executing the SQL queries under very low load to find out what the normal exection times are for both queries.
Configuration
- Load: 2 concurrent users
- Duration: 5 minutes
- SQL Warehouse Settings: Serverless, Small cluster size, Scaling min 1 to max 2
Results
max throughput ~ 1.5 requests/s
| Query Name | p50 (ms) | p95 (ms) | p99 (ms) | max (ms) | avg (ms) |
|---|---|---|---|---|---|
| Query A | 1,400 | 1,900 | 2,300 | 2,730 | 1,489 |
| Query B | 500 | 650 | 1,100 | 1,489 | 526 |
These are the baseline results. As we can see, query A takes 1,489 ms to execute on average. Query B takes 526 ms.
Load Testing Results
I ran three different load tests to test different autoscaling options and load size.
If you are not really interested in the specific numbers, feel free to skip this section and head directly to the results.
Load Test #0
Same configuration as baseline but loading it with 150 concurrent users
Configuration
- Load: 150 users
- Duration: 5 minutes
- SQL Warehouse Settings: Serverless, Small cluster size, Scaling min 1 to max 2
Results
max throughput ~ 9 requests/s
| Query Name | p50 (ms) | p95 (ms) | p99 (ms) | max (ms) | avg (ms) |
|---|---|---|---|---|---|
| Query A | 4,300 | 20,000 | 164,000 | 192,000 | 9,943 |
| Query B | 530 | 1,800 | 3,500 | 7,774 | 684 |
Screenshots
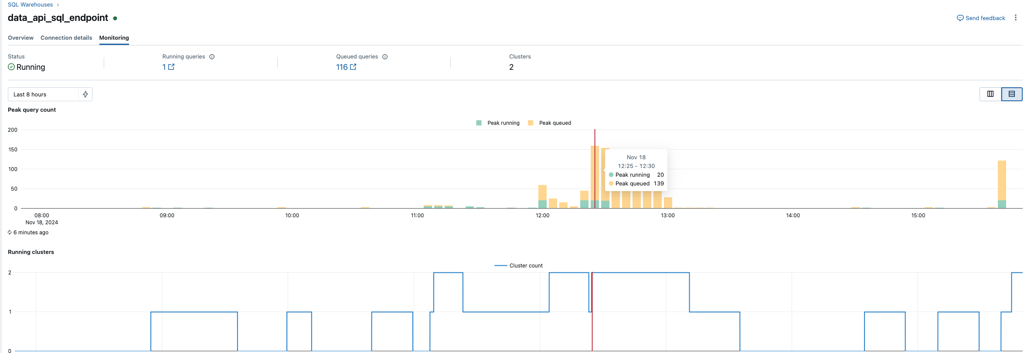
Databricks SQL warehouse screenshot showing details about the running queries, queued queries and running clusters.
Observations
- The databricks queue grows faster than queries can execute, which has a big effect on p95 and p99
- The slower query (Query A) experiences a greater performance degradation under load compared to faster queries, which are less impacted
Load Test #1
Same configuration as baseline but loading it with 150 concurrent users and increasing the number of max scaling clusters to 10
Configuration
- Load: 150 users
- Duration: 5 minutes
- SQL Warehouse Settings: Serverless, Small cluster size, Scaling min 1 to max 10
Results
max throughput ~ 35 requests/s
| Query Name | p50 (ms) | p95 (ms) | p99 (ms) | max (ms) | avg (ms) |
|---|---|---|---|---|---|
| Query A | 3,600 | 6,500 | 34,000 | 394,362 | 5,819 |
| Query B | 480 | 650 | 1,100 | 16,348 | 524 |
Screenshots
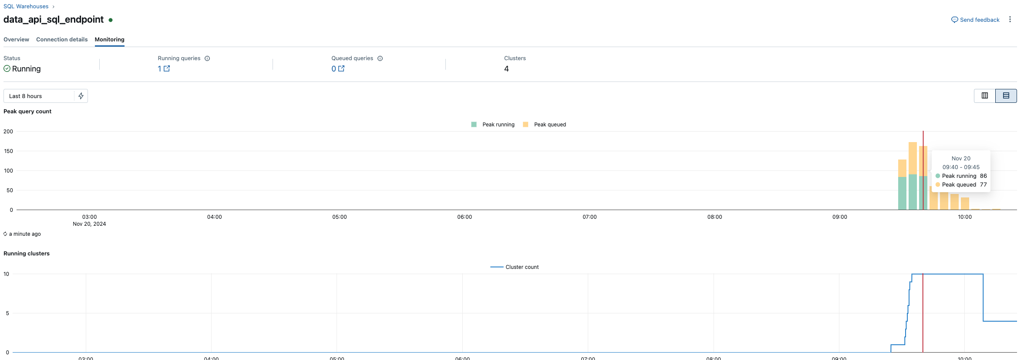
Databricks SQL warehouse screenshot showing details about the running queries, queued queries and running clusters.
Key Observations
- When clusters are at the concurrency limit, the queue size grows linearly, eventually stabilising at around 70 queries.
- Autoscaling kicks in within minutes
- During autoscaling, response time (P95) may spike briefly, but stabilises once the new clusters are active
- P99 is really bad for query A, and not too bad for query B. It implies that the slower query suffers more when the load is high.
- The max value is shockingly bad. This suggest that some of the queued queries remain in the queue for very long times. It seems like databrick’s queuing system favours faster queries and punishes slower queries with longer waiting times.
Load Test #2
Same as load test #1 but adding more users
Configuration
- Load: 300 users
- Duration: 5 minutes
- SQL Warehouse Settings: Serverless, Small cluster sizae, Scaling min 1 to max 10
Results
max throughput ~ 40 requests/s
| Query Name | p50 (ms) | p95 (ms) | p99 (ms) | max (ms) | avg (ms) |
|---|---|---|---|---|---|
| Query A | 4,000 | 7,500 | 85,000 | 240,503 | 6,171 |
| Query B | 480 | 760 | 2,300 | 18,760 | 567 |
Screenshots
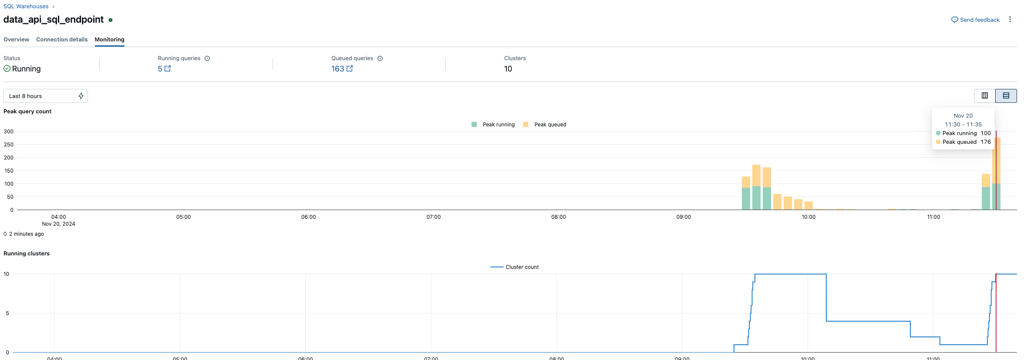
Databricks SQL warehouse screenshot showing details about the running queries, queued queries and running clusters. There are two spikes because I ran the test, then stopped and then ran it again.
Key Observations
- Autoscaling is relatively fast. 1 to 10 cluster within 4 minutes
- P95 is a bit inconsistent (spikes) while autoscaling is happening, then it stabilises
- Queries queue at a linear rate faster than they can execute after ~ 180 users
- Similar to the previous test, max execution times remained problematic
Results
The Queue
If you had a look at the SQL Warehouse’s screenshots for each of the tests, you will have noticed that they all ended up with a very large queue of queries.
This is bad, because it means that for all load tests, the resources were not enough to handle the load, which caused the queries to end up in the queue. In some cases, they were queued for very long times (as we will see in the next section).
Let’s borrow the screenshot from load test #1.

If we have a look at the peak load time when all 10 clusters were running, the peak count of concurrently running queries was 86, and the queue was 77. Almost half the queries were queued, which means that nearly 50% of the times you should expect a delayed response.
Query Execution times
The load tests showed really high max execution times, which is why we’ll use the p50 instead of the average. We’ll also be focusing on the p99.
If we plot the results for each query side by side using the same y-axis, we can barely see the latency for query B. Query A execution times are a lot higher for all experiments as compared to query B. But this is expected, because query A was already 2x slower at the baseline, so it makes sense this carries over to the load tests.
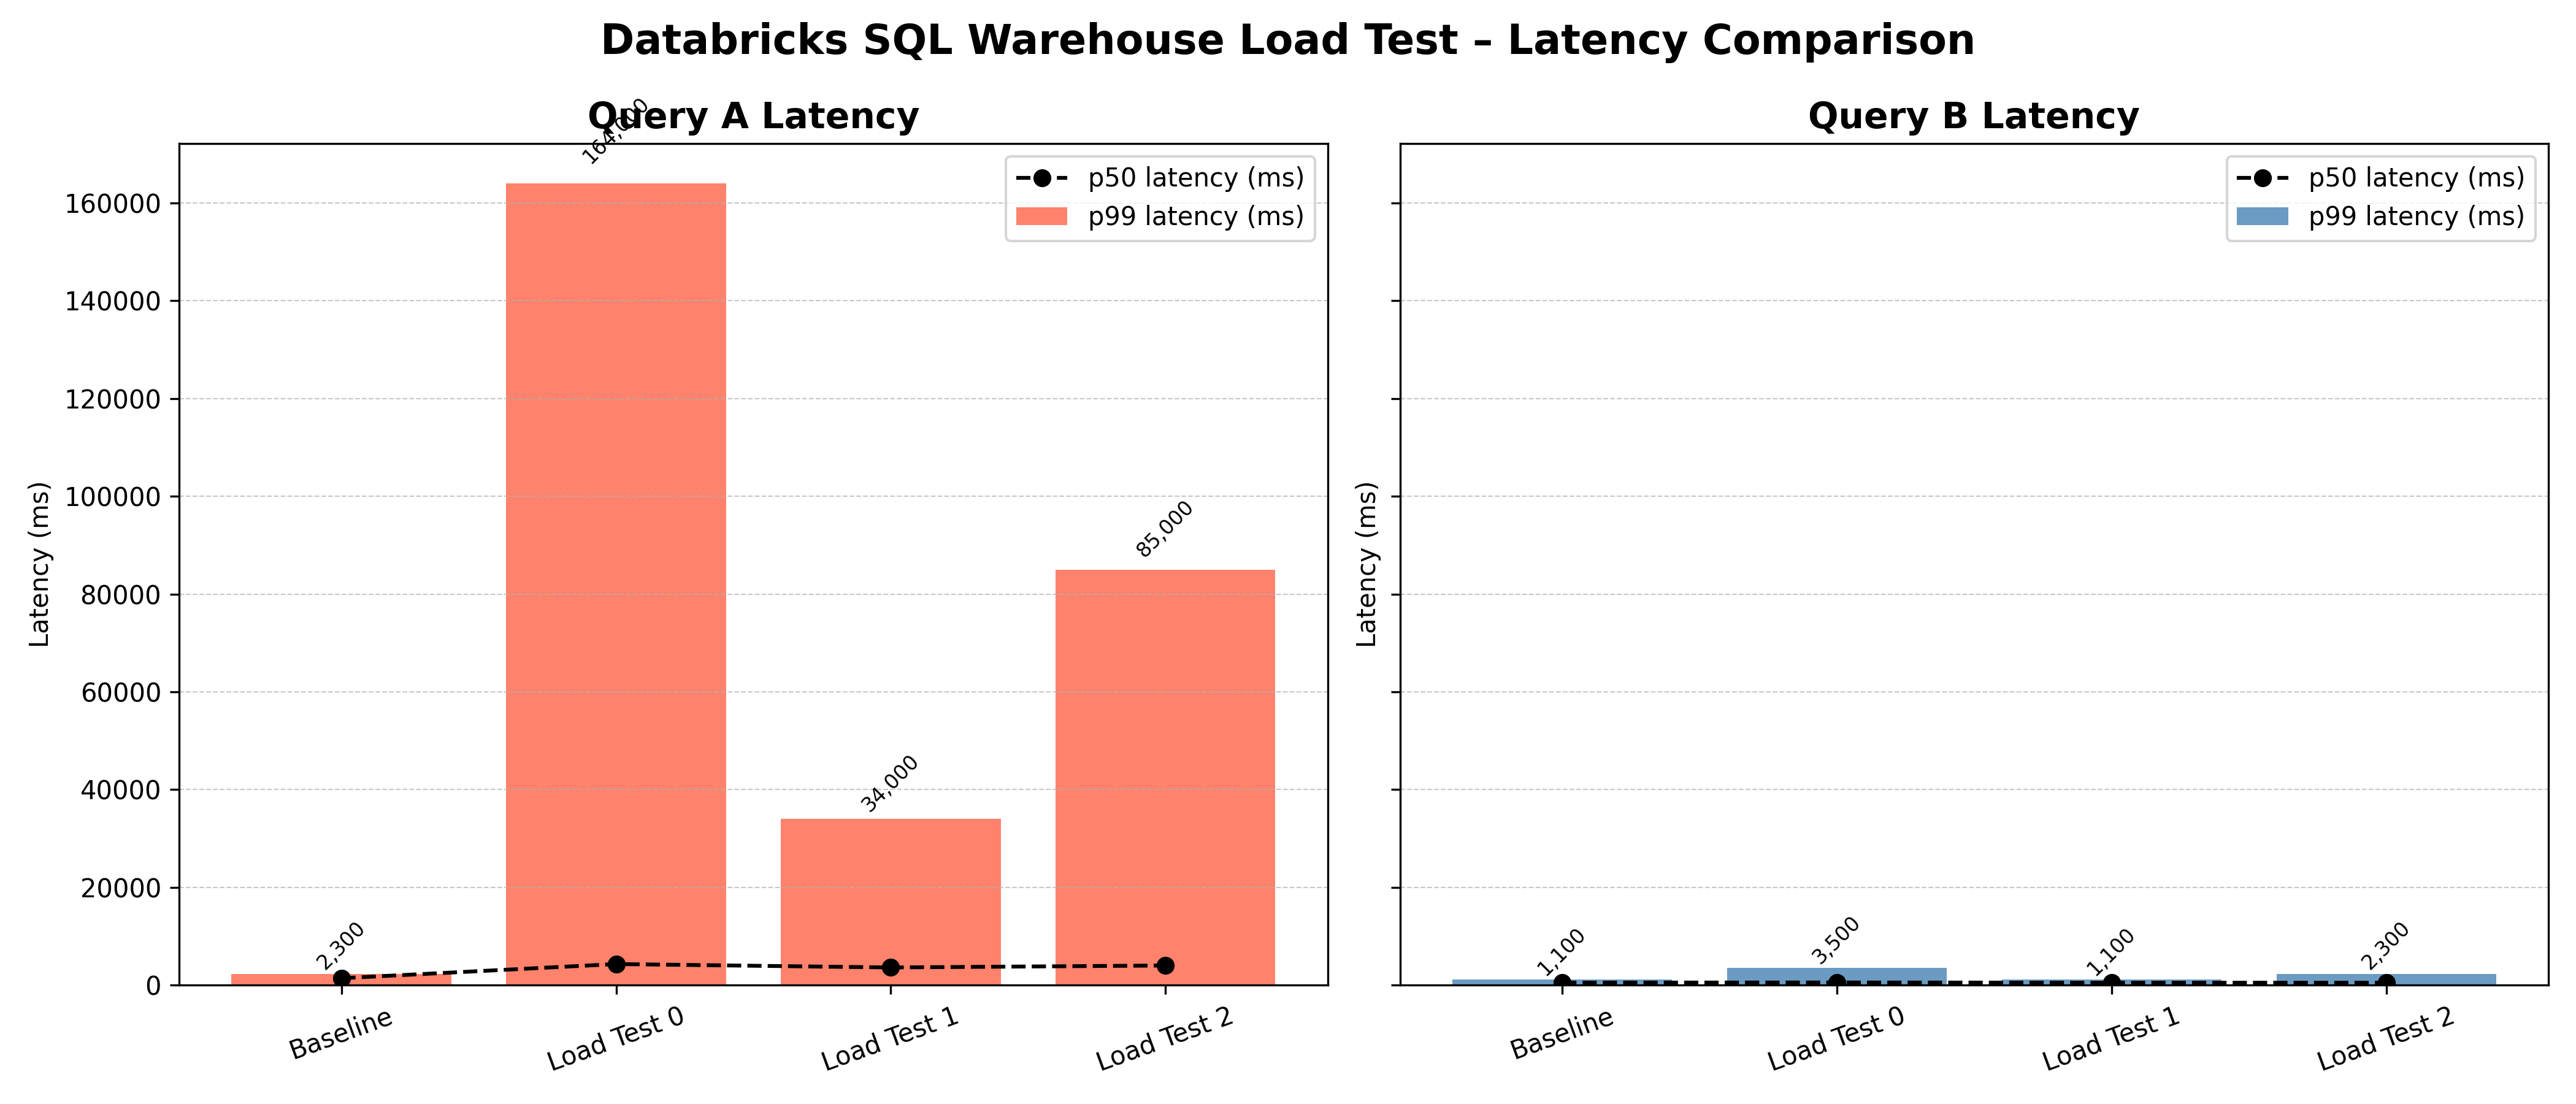
What we’re interested in finding out is the relative performance for each query.
Do both queries degrade the same under load?
To see this, let’s plot the performance degradation for each query as compared to their baseline. Each bar represents how many times worse the p99 was as compared to the baseline.
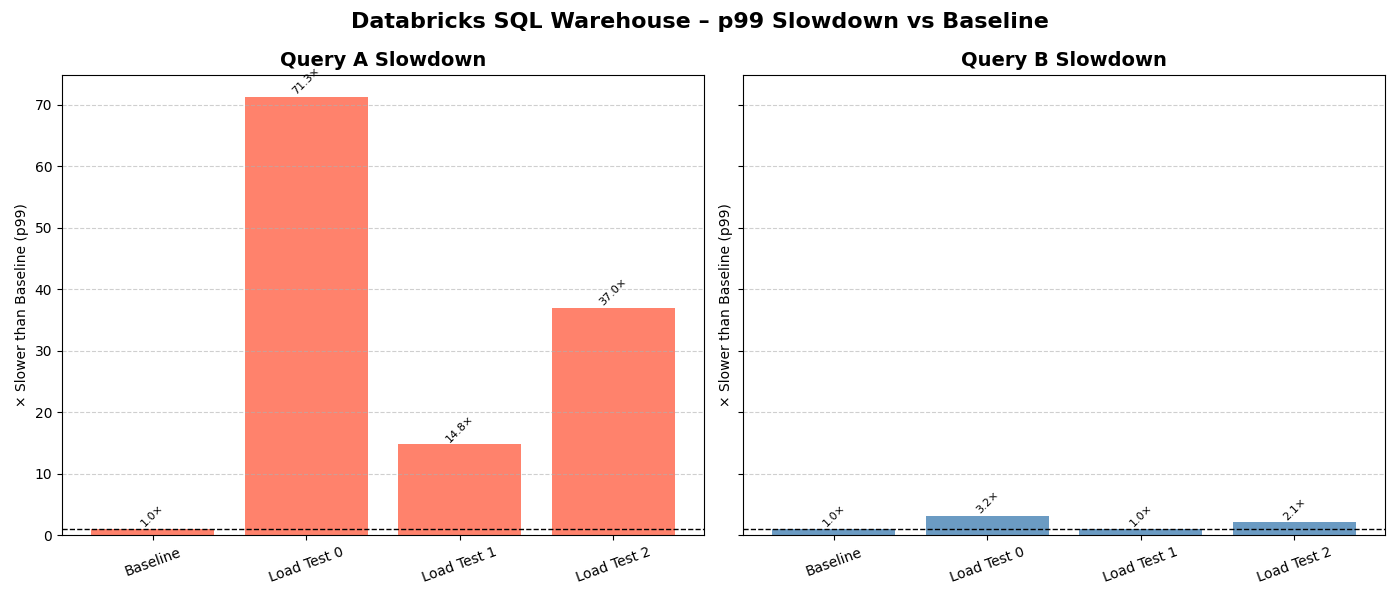
Now we can clearly see that query A has a much worse relative performance than query B for the p99 in all load tests.
This indicates that the slower the query, the worse it scales as we add more load.
Based on the queuing documentation, the reason the queue prioritises the faster queries is that it is easier to find free available capacity in the cluster for queries that are less resource intensive. The queue does not work in a FIFO format but based on available capacity in the cluster.
Queries in the queue that best fit the resource capacity at a given time get prioritised.
Cost
The cost here scales directly with the number of clusters you keep running. Assuming they are all running 24/7, going from two small serverless clusters to ten is a 5x increase in standing cost.
Of course, it may be the case where you have a few clusters running most of the time, and you only need to use the full capacity occasionally. But this should give you a rough idea of how the cost grows as you scale up the clusters.
Discussion
Cost and Performance
Running 10 clusters in serverless mode is very expensive, while only handling a maximum of 40 requests per second.
This performance and cost structure doesn’t cut it for this use case. For this type of workload, OLTP databases can offer far better throughput at a lower cost.
The only issue is the need to move data out of Databricks into the external database, which comes with its own challenges in terms of managing data pipelines and data governance. Databricks offers LakeBase as a managed solution.
Query Complexity Determines Viability
As we have seen in the results, the more resource intensive queries are, the worse they scale under load. Complex queries quickly become a bottleneck, making the warehouse an unsuitable serving solution.
You could justify creating an API hitting the SQL Warehouse directly if the query is simple, you don’t expect to scale too much and you are okay with slower SLAs.
Conclusion
Databricks SQL Warehouse can be used in production APIs, but only in specific scenarios.
It works well for simple queries with modest request volumes. For complex queries or high concurrency workloads, costs can get high and performance degrades significantly, especially for slower queries that get stuck in the queue.
The SQL Warehouse is designed for analytical workloads, not powering production APIs at scale.
Based on these findings, I moved the data into PostgreSQL for the API layer. This allowed me to add column-level indexes and partitions to optimise the tables and get sub-second performance.
While this approach requires maintaining data pipelines to keep PostgreSQL in sync with the Databricks warehouse, the performance and cost benefits made it the clear choice for the production API requirements.
About the author: I'm Pablo Lopez Santori, a senior software engineer based in Edinburgh, UK. I build scalable, distributed platforms and AI systems in production, from data infrastructure to applied AI. If you have a problem I can help with, I'm available for contract work, mostly remote and open to hybrid in Edinburgh.